Introduction
In the past few decades, zoning has been a contentious issue in New York City (NYC). Starting at the beginning of the Bloomberg administration in 2002, the city undertook rezonings at a faster and more aggressive pace. Rezonings were a way to promote growth while targeting certain neighborhoods. Under de Blasio’s administration, rezonings have continued (Angotti & Morse, 2017). They are critical to the administration’s goal of creating 300,000 affordable apartments by 2026 (Spivack, 2020). The city initially set out to rezone 15 neighborhoods, but as of September 2020, it had only rezoned 6 (Kully, 2020). In some neighborhoods like Bushwick, Sunset Park, Inwood, and most recently Soho/Noho, residents and community groups have fiercely contested the rezonings.
What is Zoning?
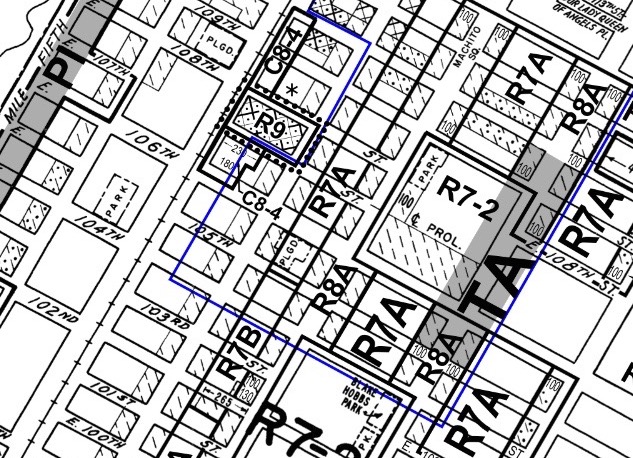
Zoning: "a law that organizes how land may be used" (NYC Planning, n.d.-e). It controls several aspects of land use:
- whether the land can be used for residential, commercial, industrial, or mixed-use purposes
- how much can be built on the land
- how much land must remain unbuilt
There are also special purpose districts, which often have an underlying goal such as increasing economic activity or limiting development in areas vulnerable to flooding (NYC Planning, n.d.-d).
Given an area’s existing zoning designations, one can usually develop on a lot “as of right” — i.e. with only the relevant building permits. However, if a proposed development doesn’t conform to the zoning, developers or, in some cases, the Department of City Planning Commission (DCP) will need to change it (Williams, 2018). The city has the authority to amend zoning “for the conduct of planning relating to the orderly growth, improvement and future development of the city" (NYC Planning, n.d.-b).
The process of amending the zoning designations is called the Uniform Land Use Review Procedure (ULURP). ULURP can last between 7–9 months and involves public hearings with the community board, borough president, city council, and mayor (ULURP Explained , n.d.). The community board’s vote is advisory. And if any of the other bodies vote no, either the borough president, city council, or mayor can veto the decision.
Although rezonings can spur growth and produce much-needed housing, research in New York City over the past ten years has identified that rezonings are rarely race or class neutral. A 2010 report by the NYU Furman Center found that rezonings were more likely to be in neighborhoods with larger shares of Black and Latinx residents and with lower median incomes compared to citywide numbers (Armstrong et al., 2010). The 2016 book Zoned Out deals extensively with the notion that rezonings are discriminatory. In detailed case studies on Williamsburg, Harlem, and Chinatown, the authors argue that new development — with increasing prices and inadequate zoning protections — has resulted in the displacement of low-income communities and communities of color (Angotti & Morse, 2017). At the same time, DCP’s use of downzoning and contextual zoning has preserved high-income, majority-white enclaves — often at the expense of the less affluent surrounding neighborhoods (Angotti & Morse, 2017). Recently, the Association for Neighborhood Housing and Development (ANHD) published a report on rezonings that identified two important findings: (1) neighborhood rezonings (i.e. those proposed by the city) are less effective than other types of rezonings and (2) neighborhood rezonings are least beneficial in Majority Black Indigenous People of Color/Low Income areas (Walters, 2021).
Purpose
Given zoning's contentious position in NYC’s planning history, my goal is to descriptively assess how rezonings have affected land use patterns. Although a rezoning changes what is permissible on a given lot, it doesn't prescribe a certain type of use. Comparing lot-level data citywide and in areas that have been rezoned between 2010 to 2020, I examine changes in the number of residential units, building class descriptions, and land use categories.
Note: I do not distinguish between downzonings, upzonings, and hybrid rezonings nor do I distinguish between rezonings initiated by the city or by individuals. Both categories have been the subject of previous research and would be useful categories to explore further in expanding the scope of this article (Goldberg, 2015; Walters, 2021).
Data Sources & Methodology
Data on lot-level characteristics and zoning amendments come from New York City’s Department of City Planning (DCP) (NYC Planning, n.d.-a). DCP produces the Primary Land Use Tax Lot Output (PLUTO™) by merging tax lot data with columns from the Department of Finance’s Digital Tax Map (DTM) and information from other city agencies. Polygon shapefiles of zoning amendments since 1977 come from the NYC GIS Zoning Features geodatabase, which DCP updates monthly (NYC Planning, n.d.-c). Updates include recent zoning changes adopted by the City Council. Other spatial data files come from DCP’s open data site (NYC Planning, n.d.-a).
In comparison to current research on zoning in NYC, the scope of this article is narrow. After reviewing the changes in zoning amendments between 2010 and 2020, I compare the average number of residential units, building class description differences, and land use category differences between these two periods. I first joined version 8 of MapPLUTO for 2020 with version 1 for 2010 using a point-to-polygon spatial join. I also created a secondary dataset that intersected MapPLUTO records with all geographies for rezonings adopted between 2010 and 2020.
I first sought to understand general trends in rezonings. To do this, I calculated the number of rezonings and the area percentage of rezonings citywide, by borough, and by neighborhood. I also produced maps to illustrate where rezonings have occurred since 1977 and between 2010 and 2020.
Then, I examined differences in residential units, building class descriptions, and land use categories between 2010 and 2020 citywide and for the areas where rezonings occurred. Since building class descriptions and land use categories are highly detailed, it was difficult to observe broad trends. As a result, I created four indicators to study more general land use patterns: growth in residential housing and vacant land and declines in residential housing and public and outdoor space. With these indicators, I calculated the percentage of rezoned lots that experienced these events by neighborhood. Simplifying changes in land use to only four key outcomes allowed me to view the spatial distribution of trends more clearly.
Results
I. Where Rezonings Occur
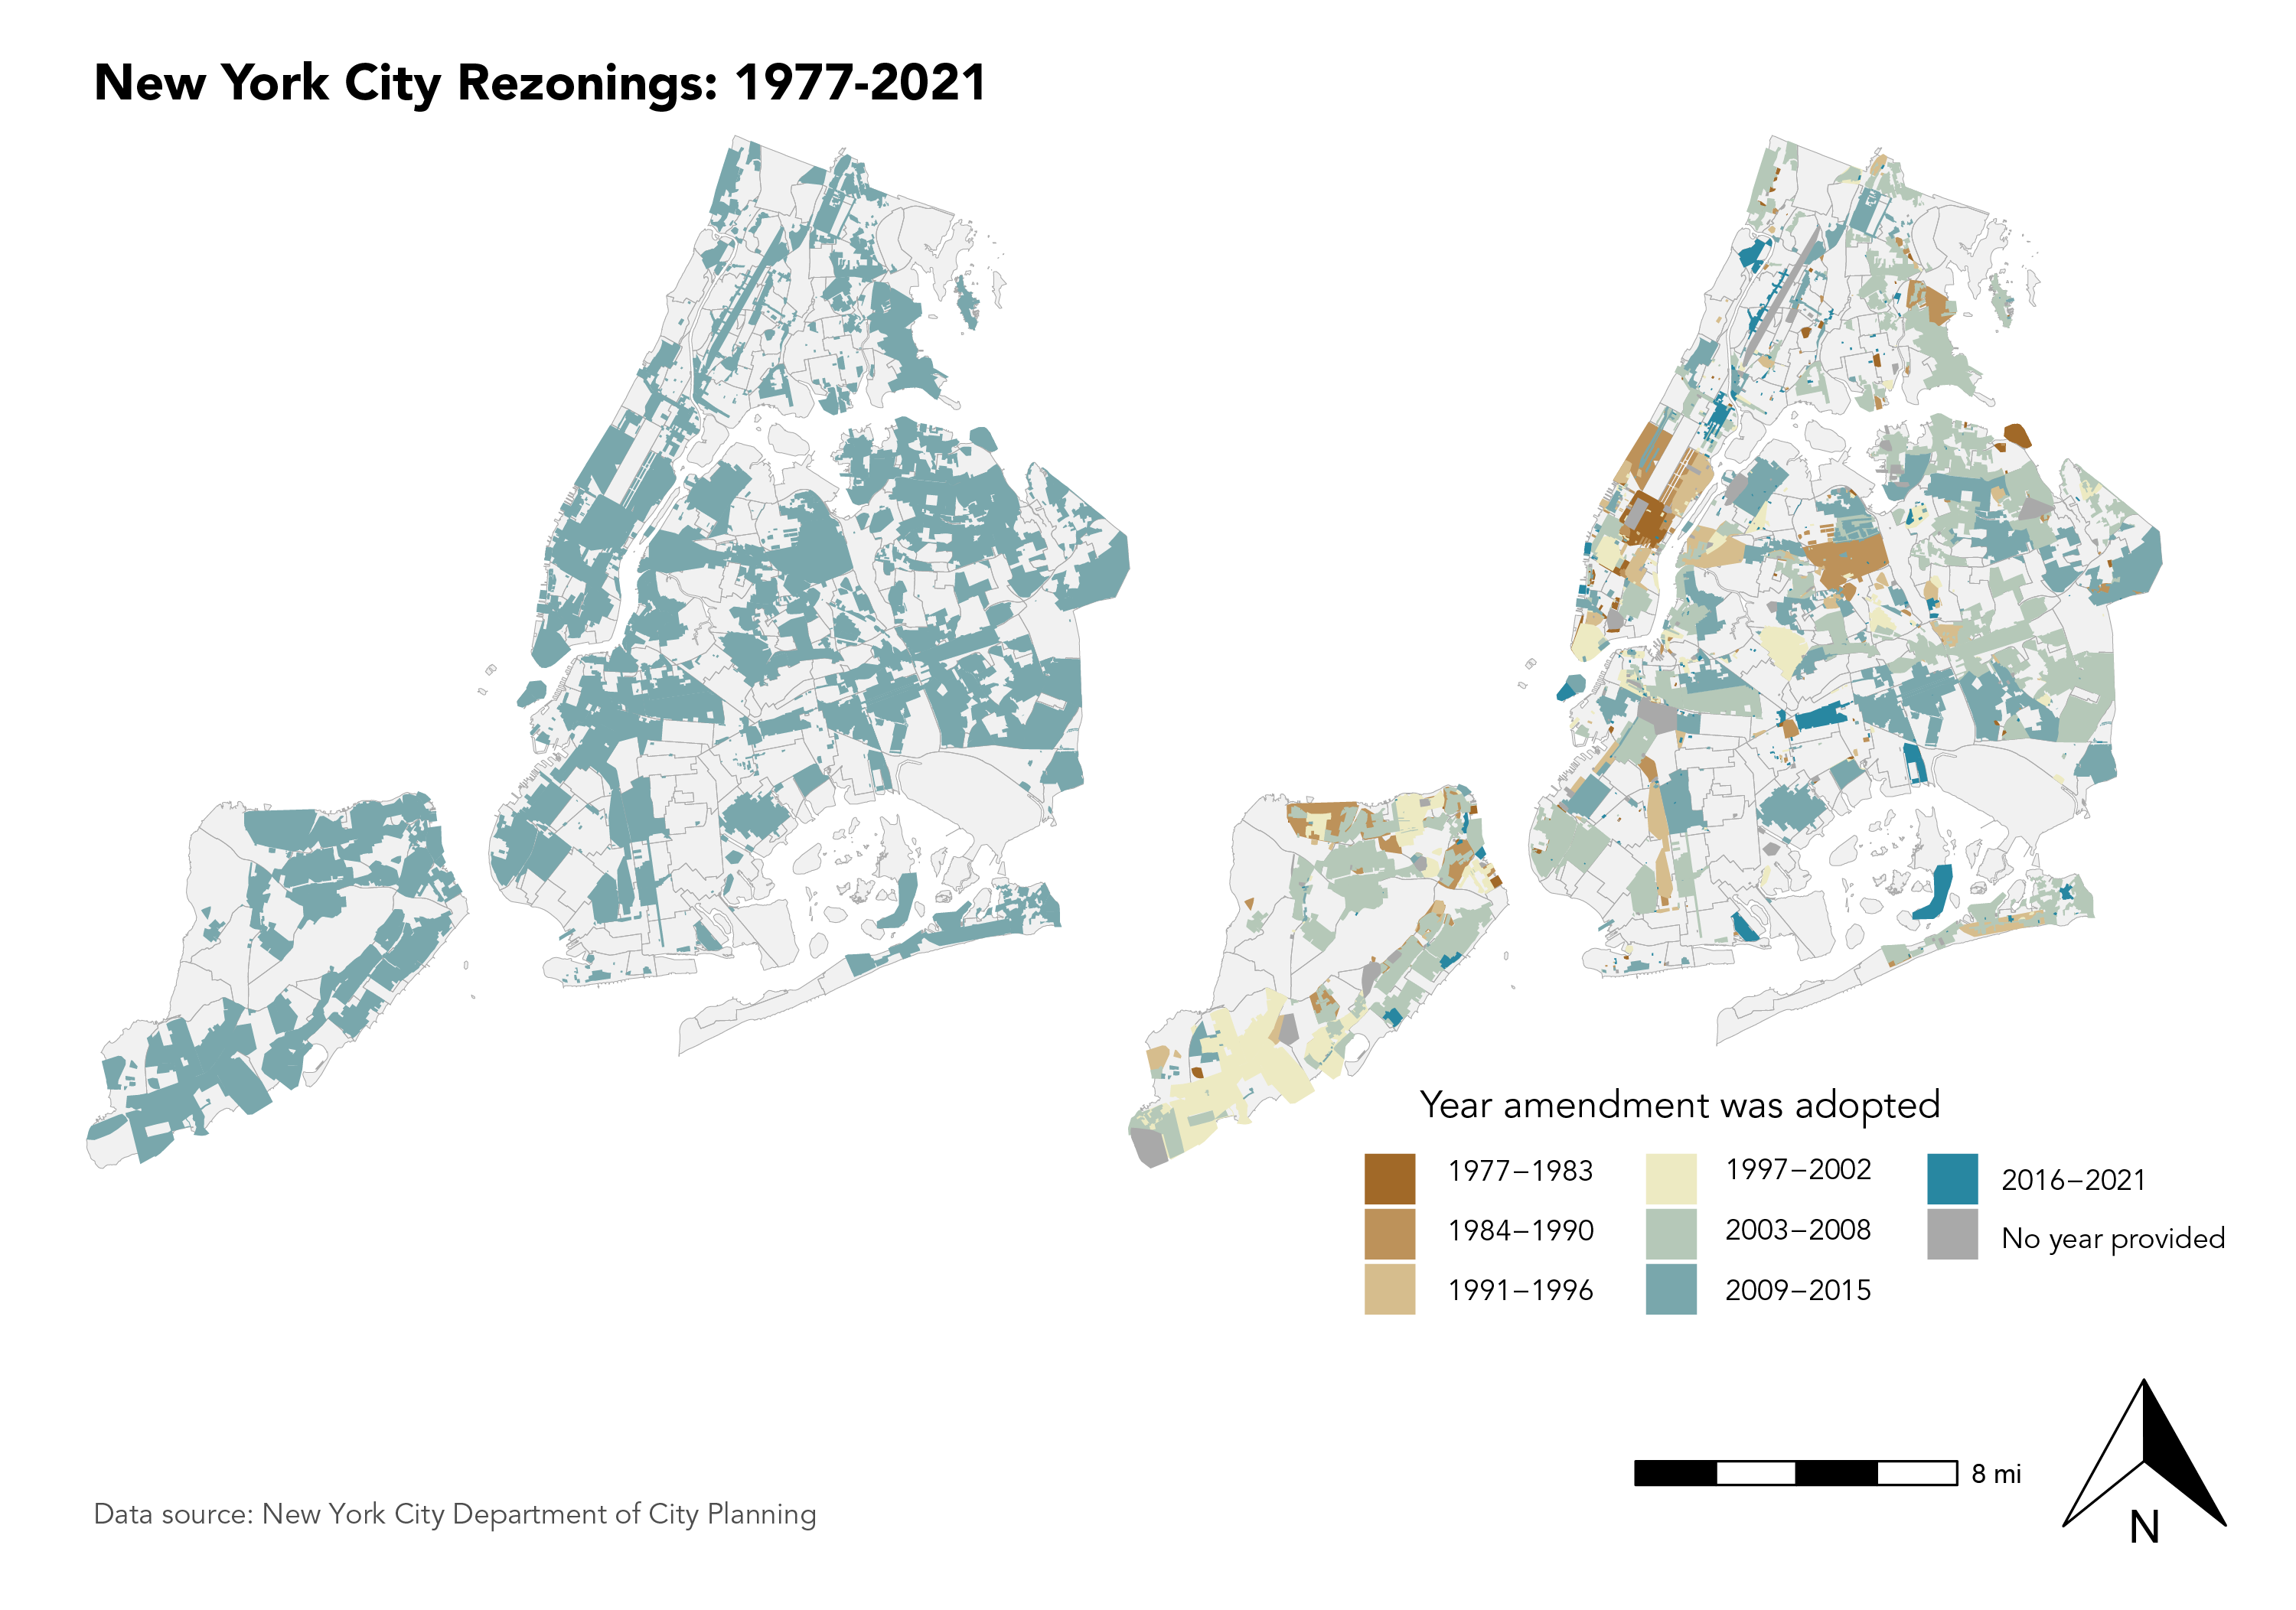
Since 1977, almost 50% — equivalent to 149 square miles — of the land area in the city has undergone a zoning change. Differences are more pronounced by borough. In Manhattan, for example, 69% of the borough has been rezoned since 1977 compared to 33% of the Bronx. In the last decade, the percentages are much smaller and the pattern changes. For instance, while 67% of Staten Island has been rezoned since 1977, only 2% has been rezoned between 2010 and 2020.
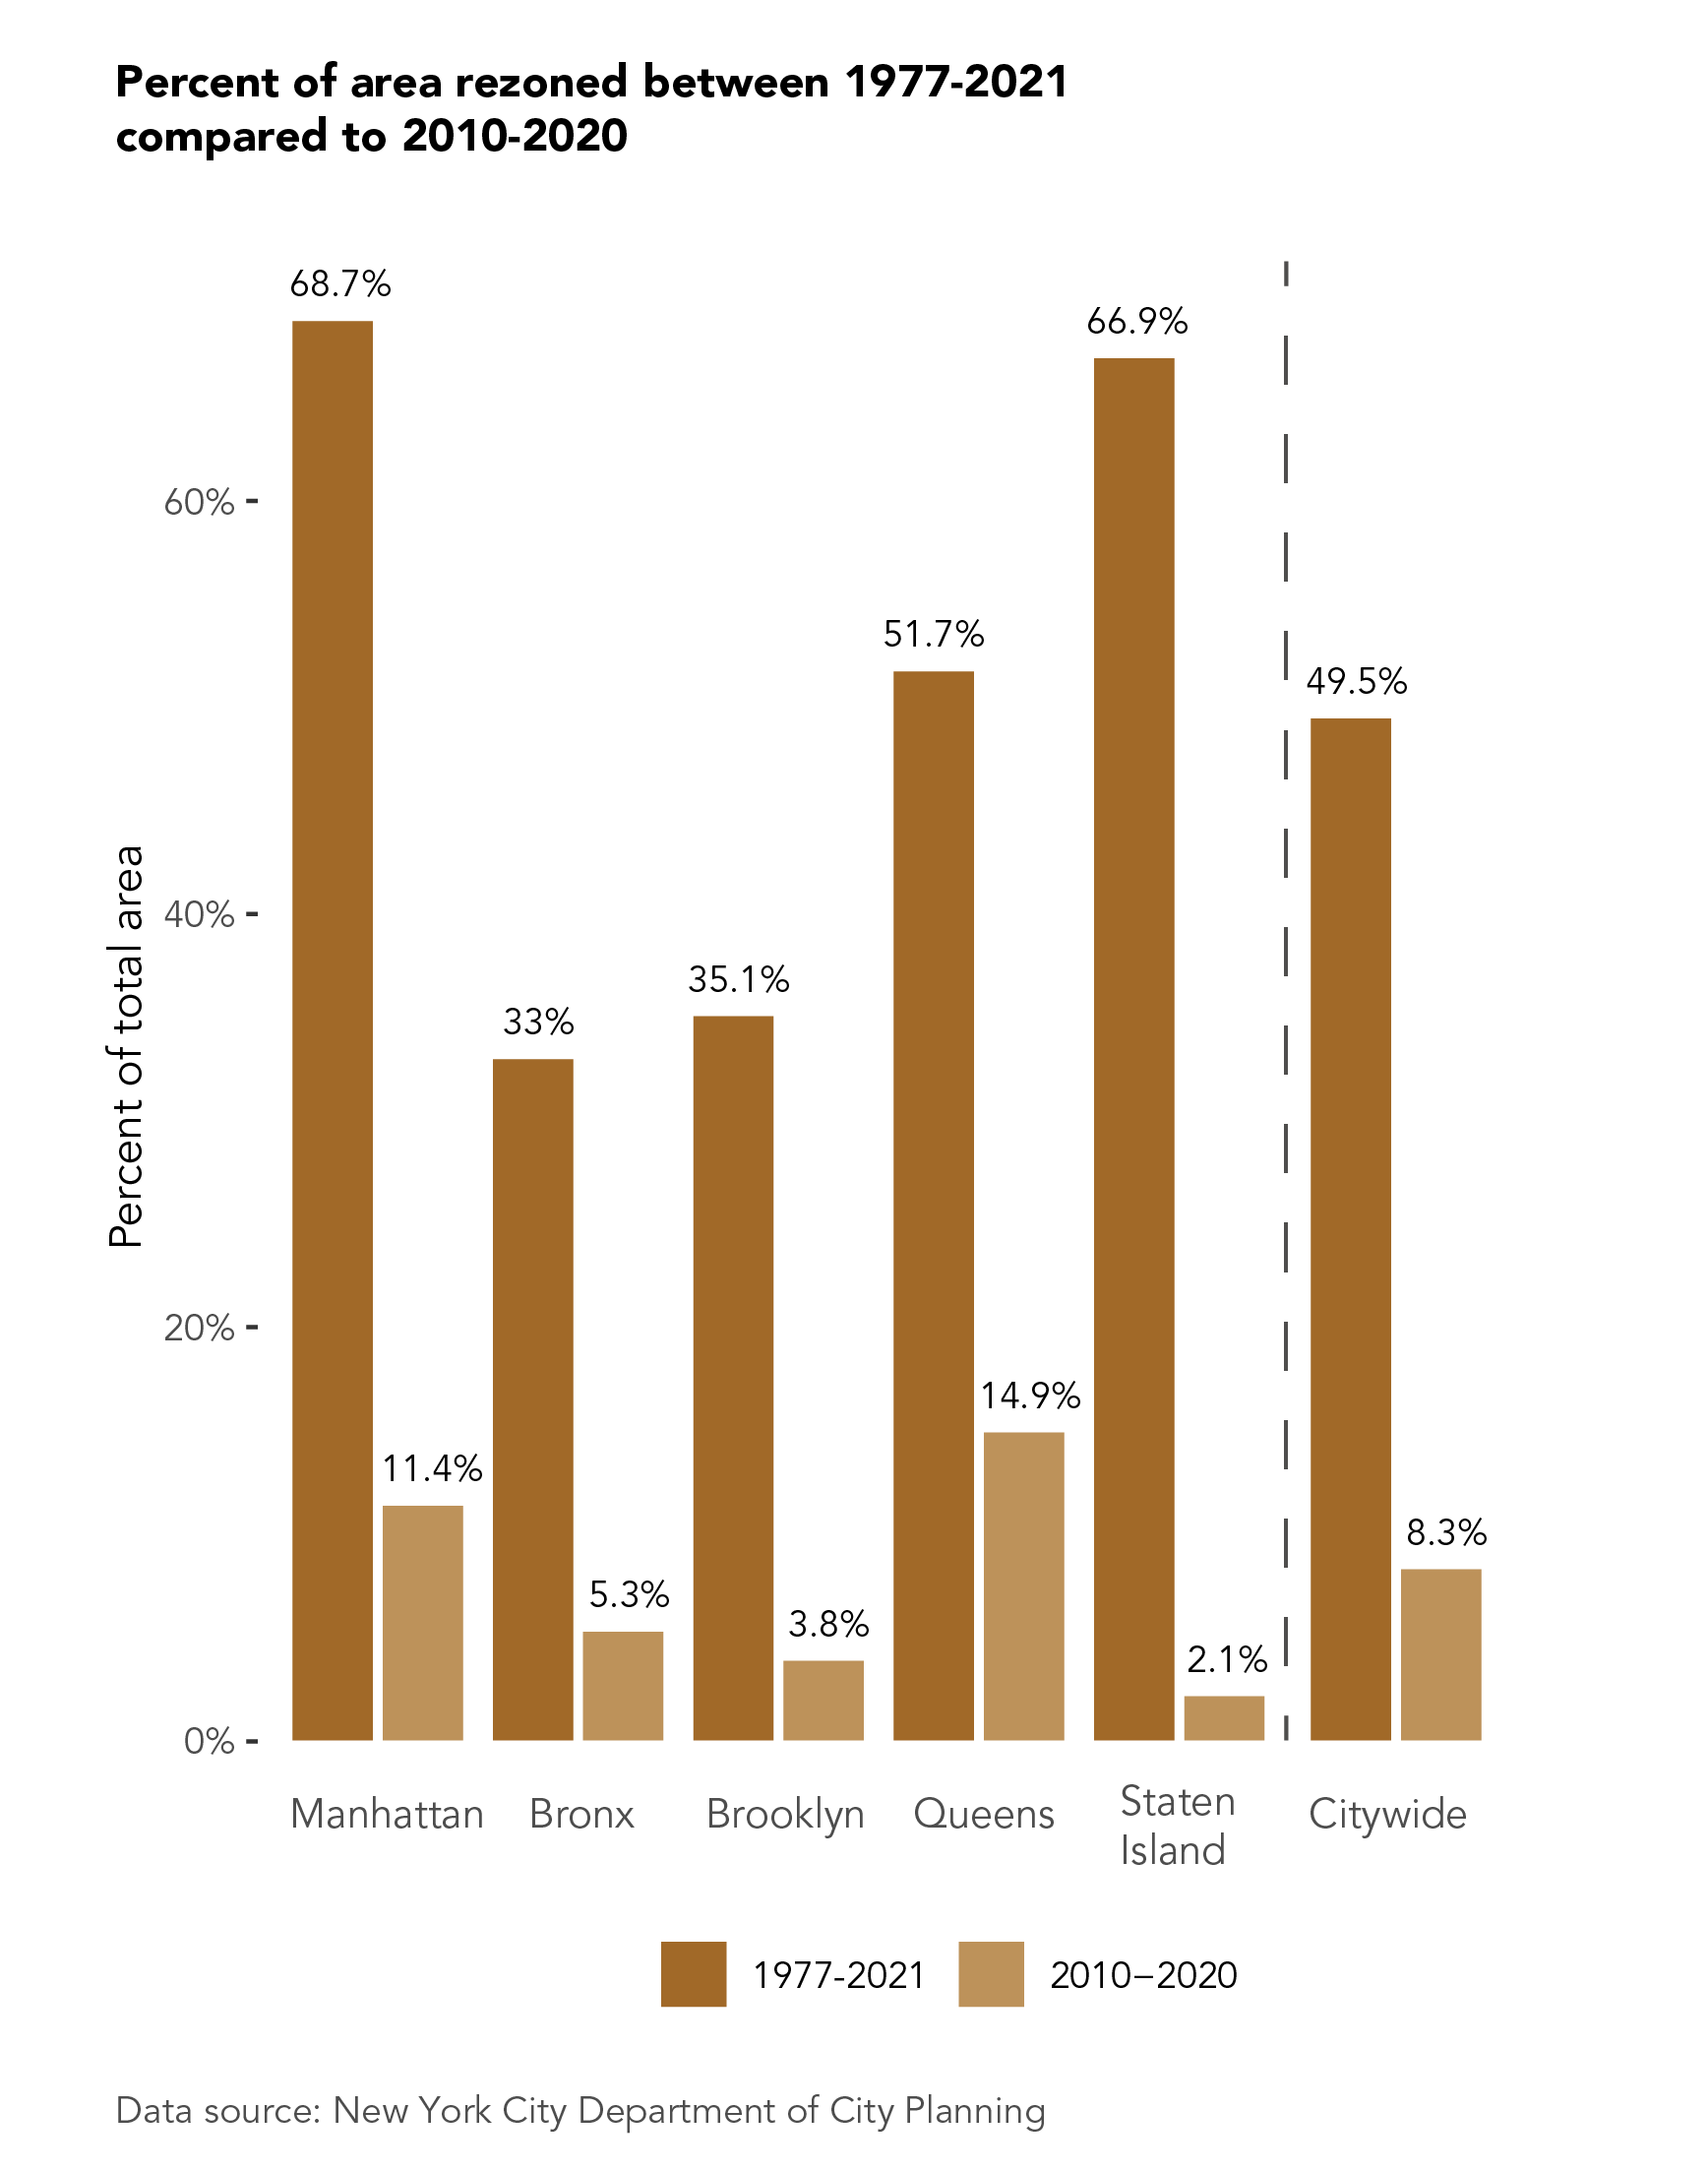
The highest percentage of rezonings between 2010 and 2020 occurred in Queens with 15% of the borough’s geographic area rezoned between 2010 and 2020. And Manhattan, which had the highest area percentage of rezonings since 1977, also had the second highest area percentage between 2010 and 2020.
Comparing 1977–2021 to 2010–2020 does obscure some nuanced temporal patterns. For instance, the map below reveals that there were many rezonings in the 1970s and 1980s in midtown and uptown Manhattan. Since 2008, more rezonings have occurred in northern Manhattan and the outer boroughs — particularly the Bronx and Queens. The 2009–2015 and 2016–2021 rezonings primarily reflect the agenda of the de Blasio administration, which took office in 2013.
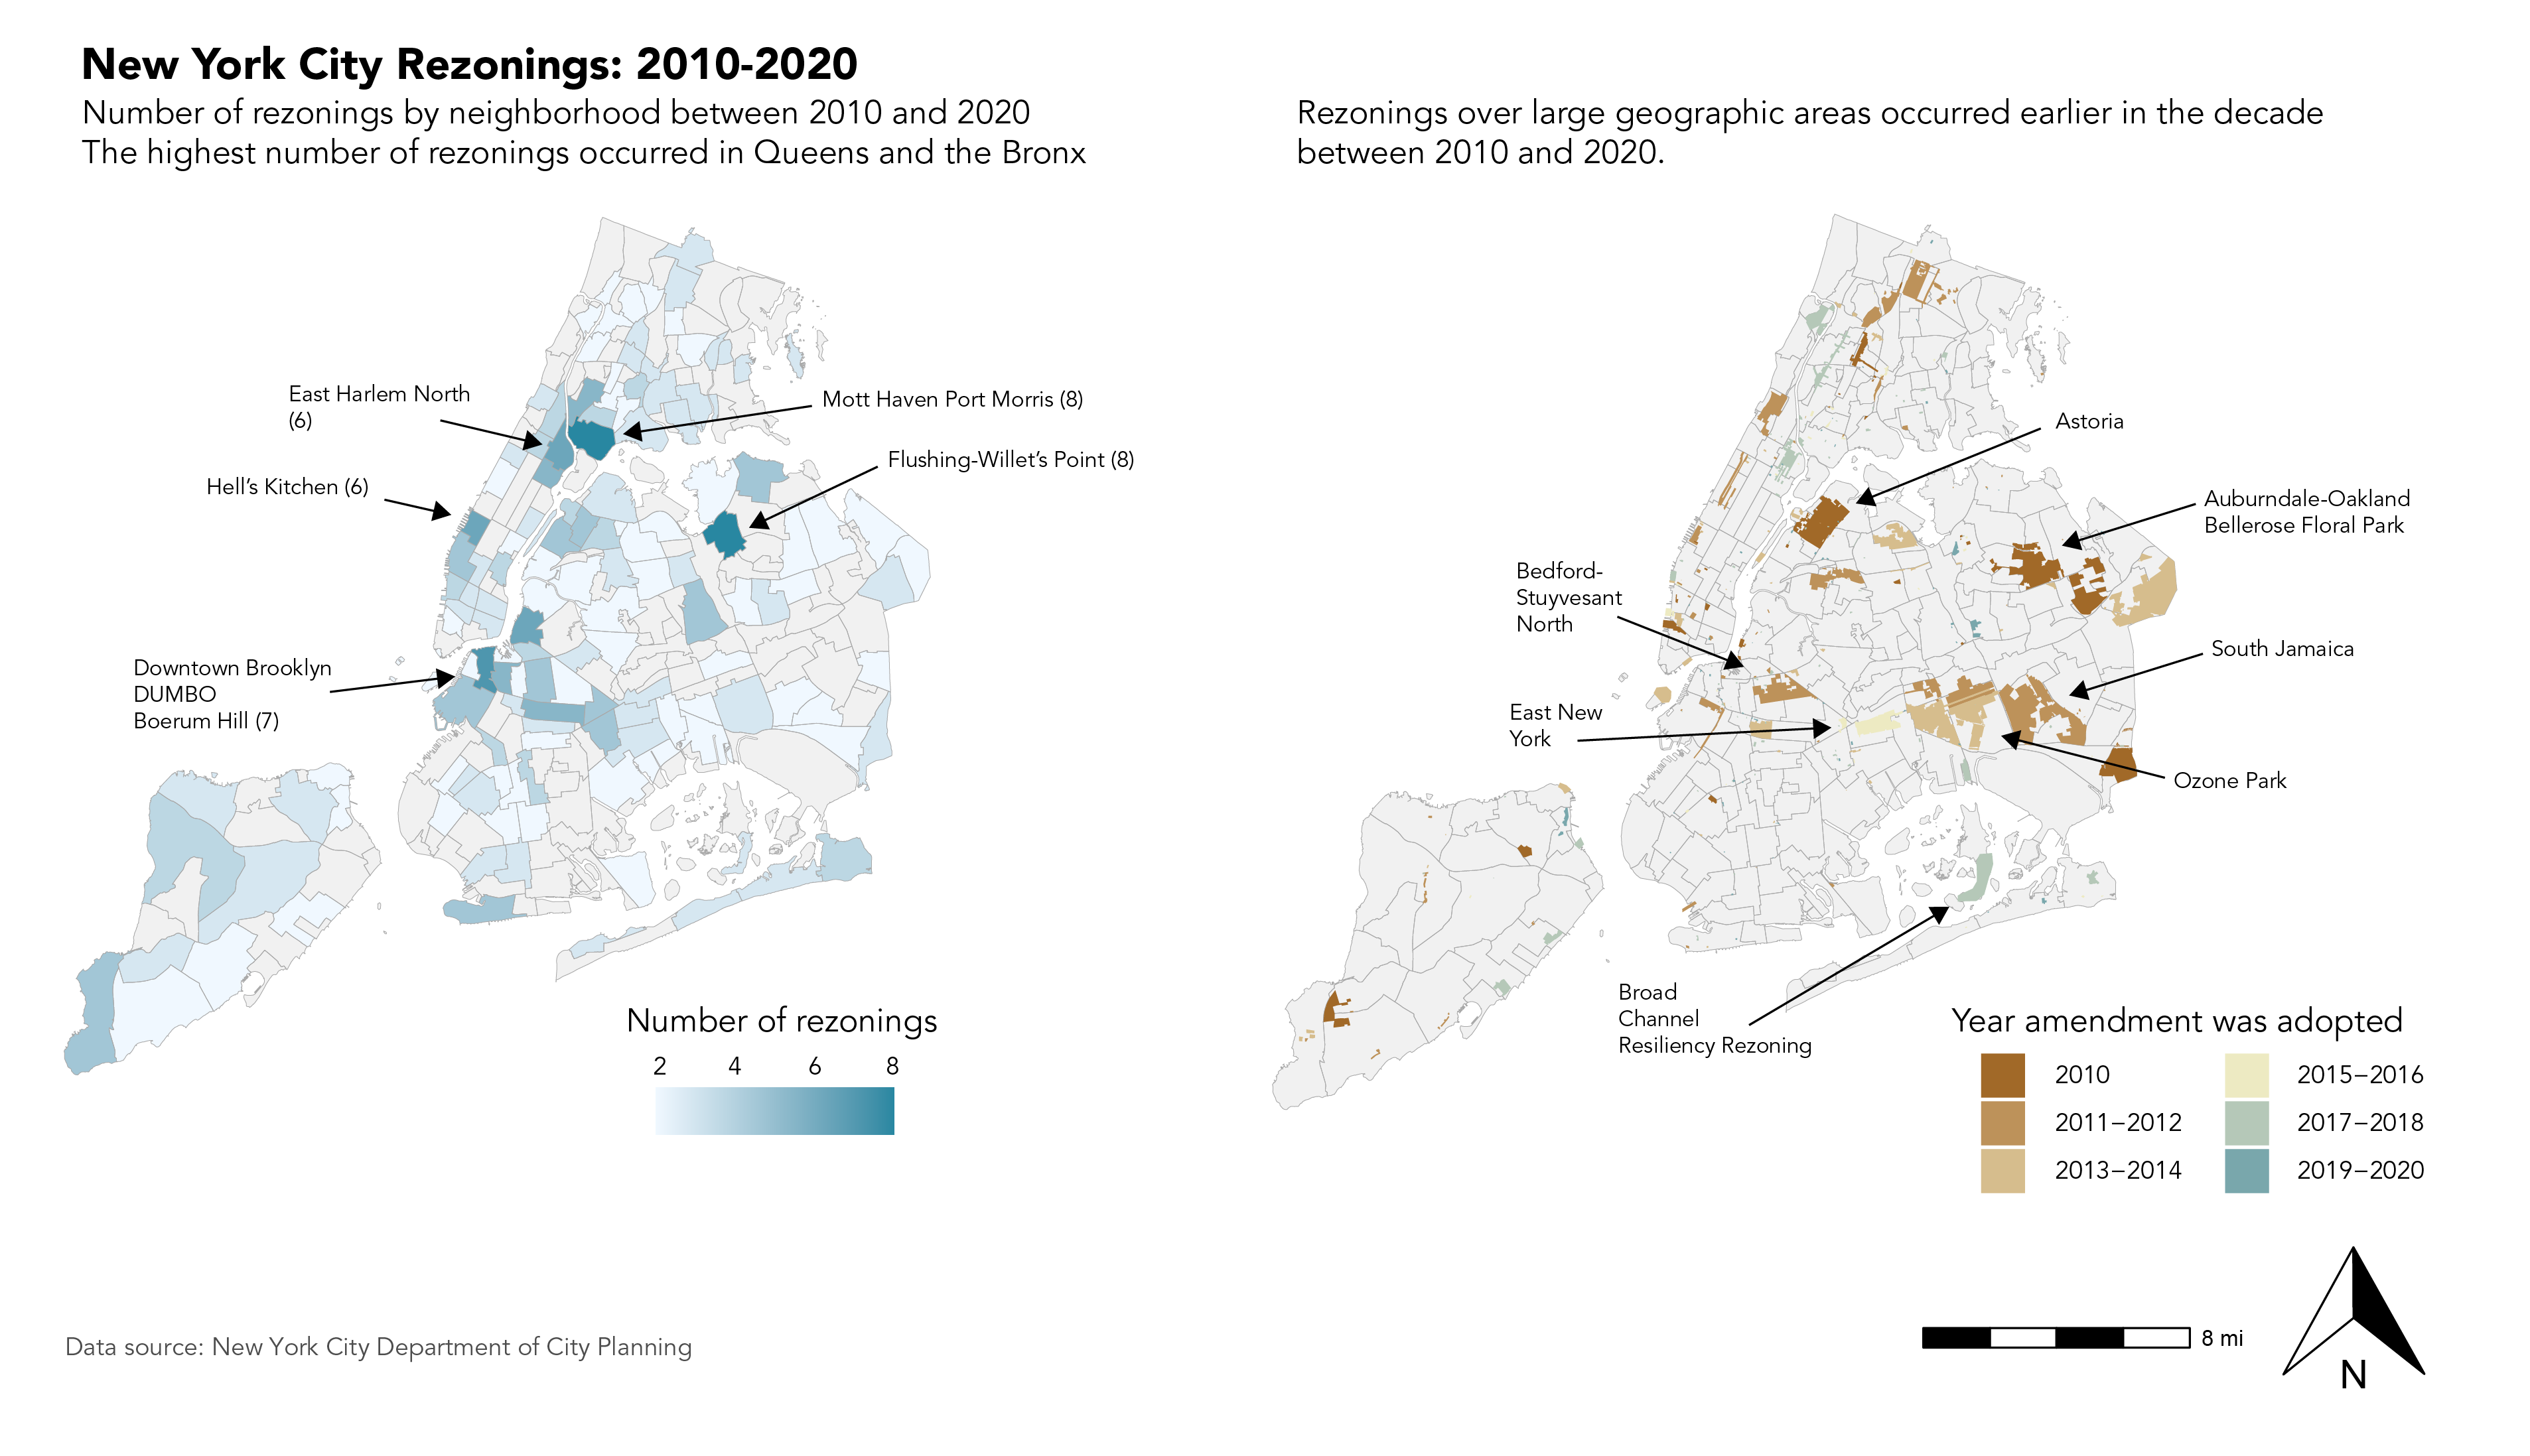
The maps above focus on the 2010–2020 time period and reveal time trends with more precision. The figure on the left shows the distribution of the number of rezonings: neighborhoods in all of the city’s boroughs experienced multiple rezonings. The two neighborhoods with the highest number of rezonings were Mott Haven Port Morris and Flushing-Willett’s Point. It’s difficult to tell from the map how extensive each rezoning was — in terms of the geographic area and when they occurred. This information instead is more clearly conveyed in the map on the right and highlighted with arrows are the rezonings with the largest geographic areas. While Flushing-Willet’s Point had the highest number of rezonings, in terms of space the rezoning area was quite small. Instead, neighborhoods like Jamaica, Astoria, and Ozone Park experienced rezonings on a much larger spatial scale. Ozone Park, for example, was one of the last and among the largest rezonings under the Bloomberg administration (Rafter, 2013). The rezoning in Jamaica was also considered one of the largest and most comprehensive rezonings; it affected around 500 city blocks (CityLand, 2007). The largest rezonings all occurred before 2015. Most of the rezonings since have been much smaller in scale.
II. Residential units, building class, and land use differences
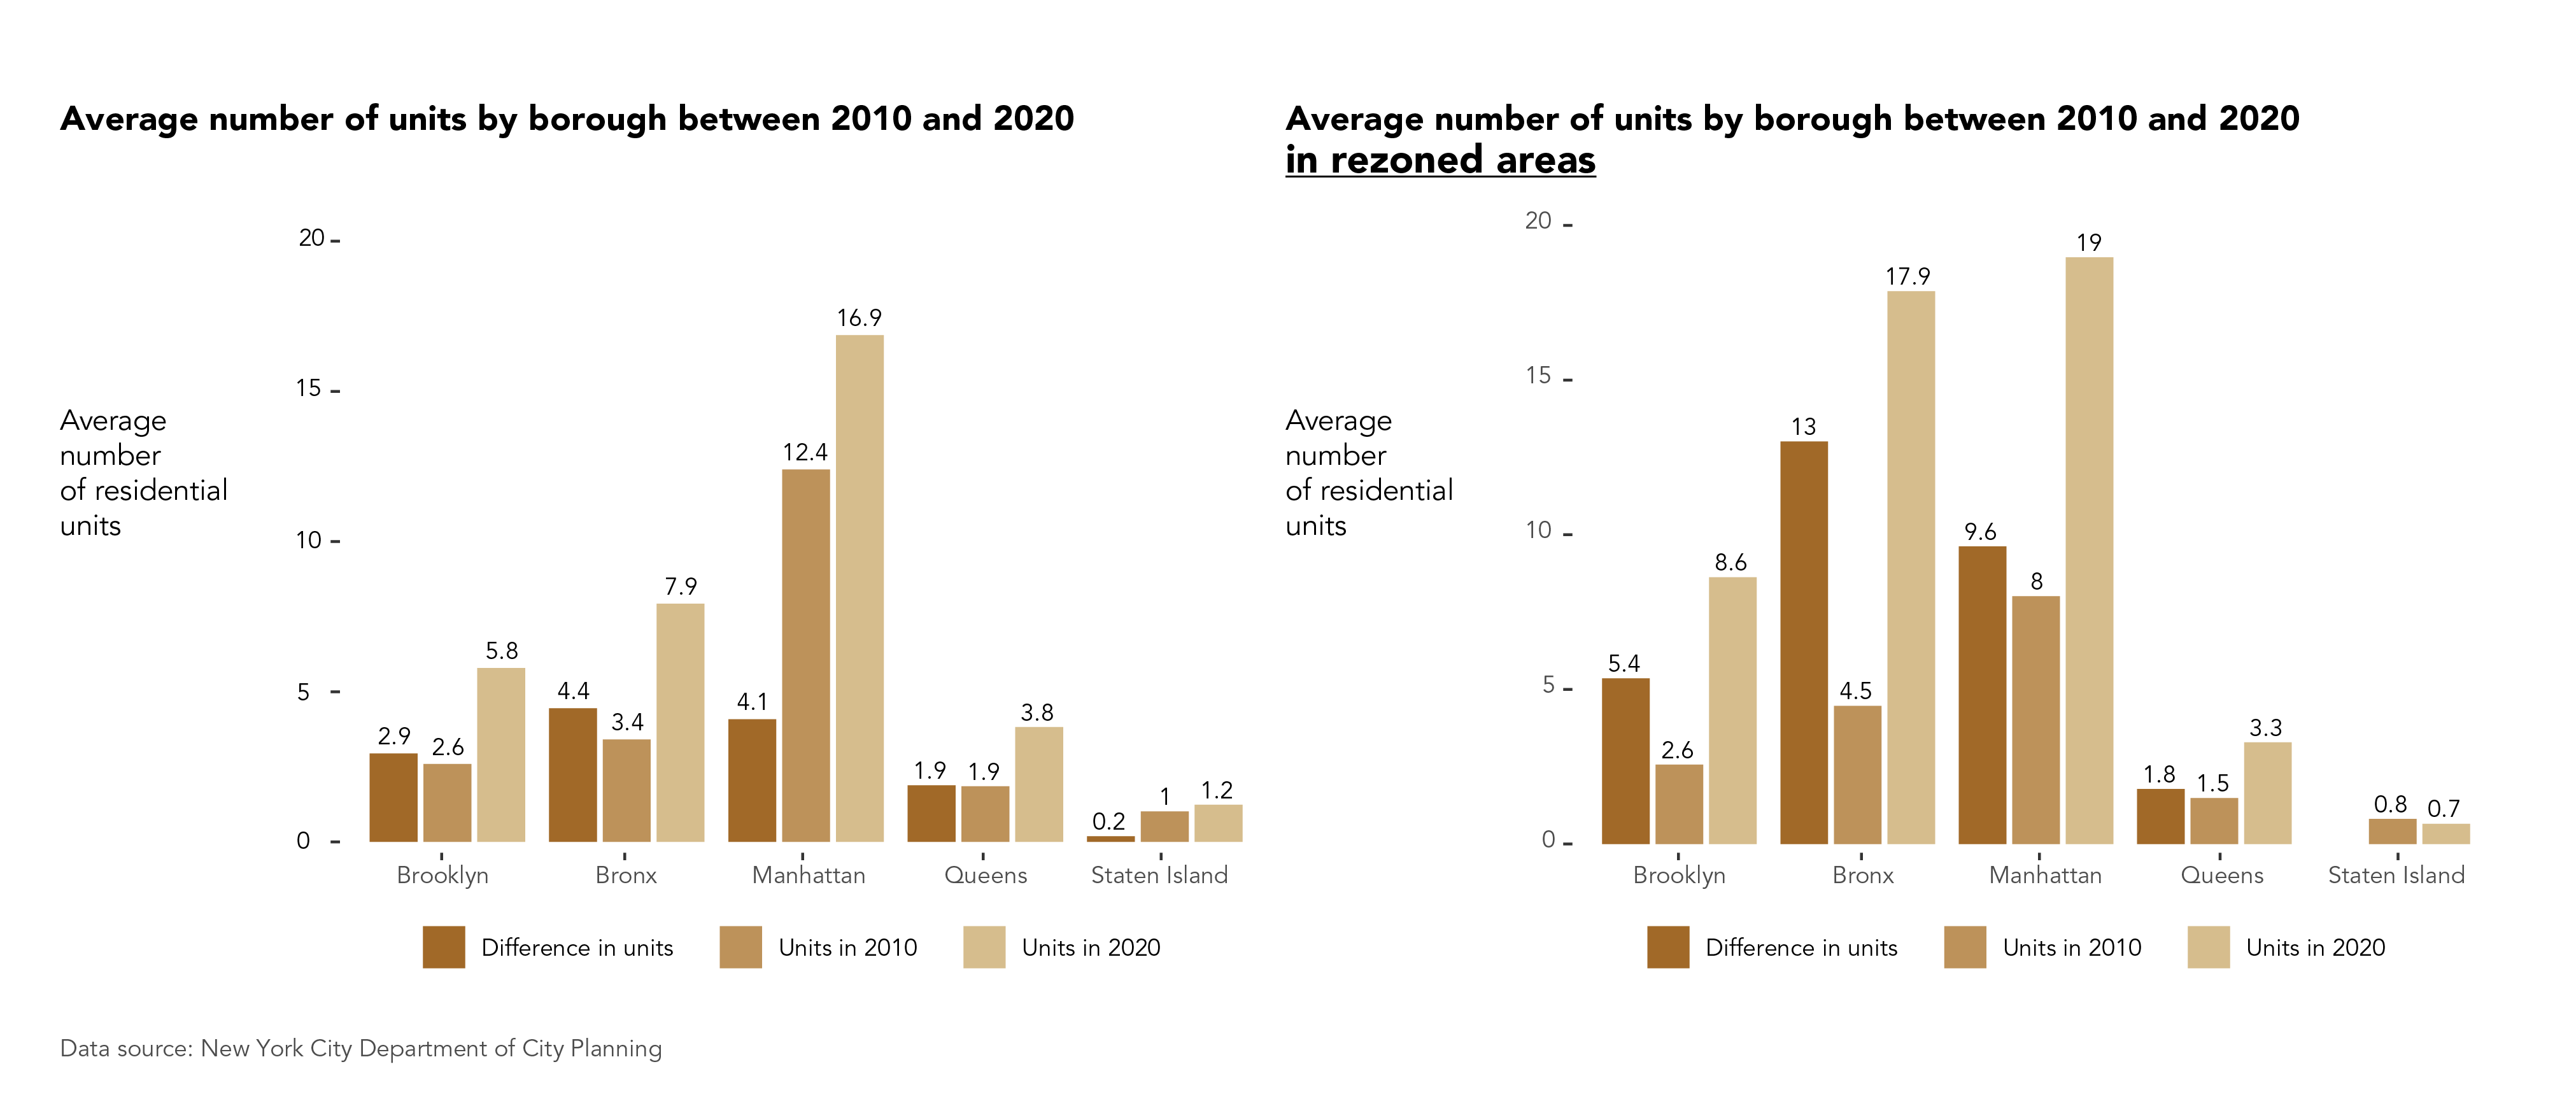
Planners frequently use rezonings as a way to incentive residential development and affordable housing (Angotti & Morse, 2017; Gates, 2020). As a result, I expect rezoned areas to experience greater increases in residential units on average. The effect of upzoning, illustrated in the figure above, may be neutralized by simultaneous downzoning in the same area, which would constrain and disincentivize new residential development. Differences in the average number of residential units are higher in the rezoned areas in the Brooklyn, Bronx, and Manhattan boroughs. The Bronx is the most extreme: in all areas, the difference in average residential units between 2010 and 2020 is 4.4, but in rezoned areas, the difference is 13. The average number of residential units is slightly higher in 2020 for buildings in both Queens and Staten Island, and in both boroughs the differences between citywide calculations and rezoned areas are small.
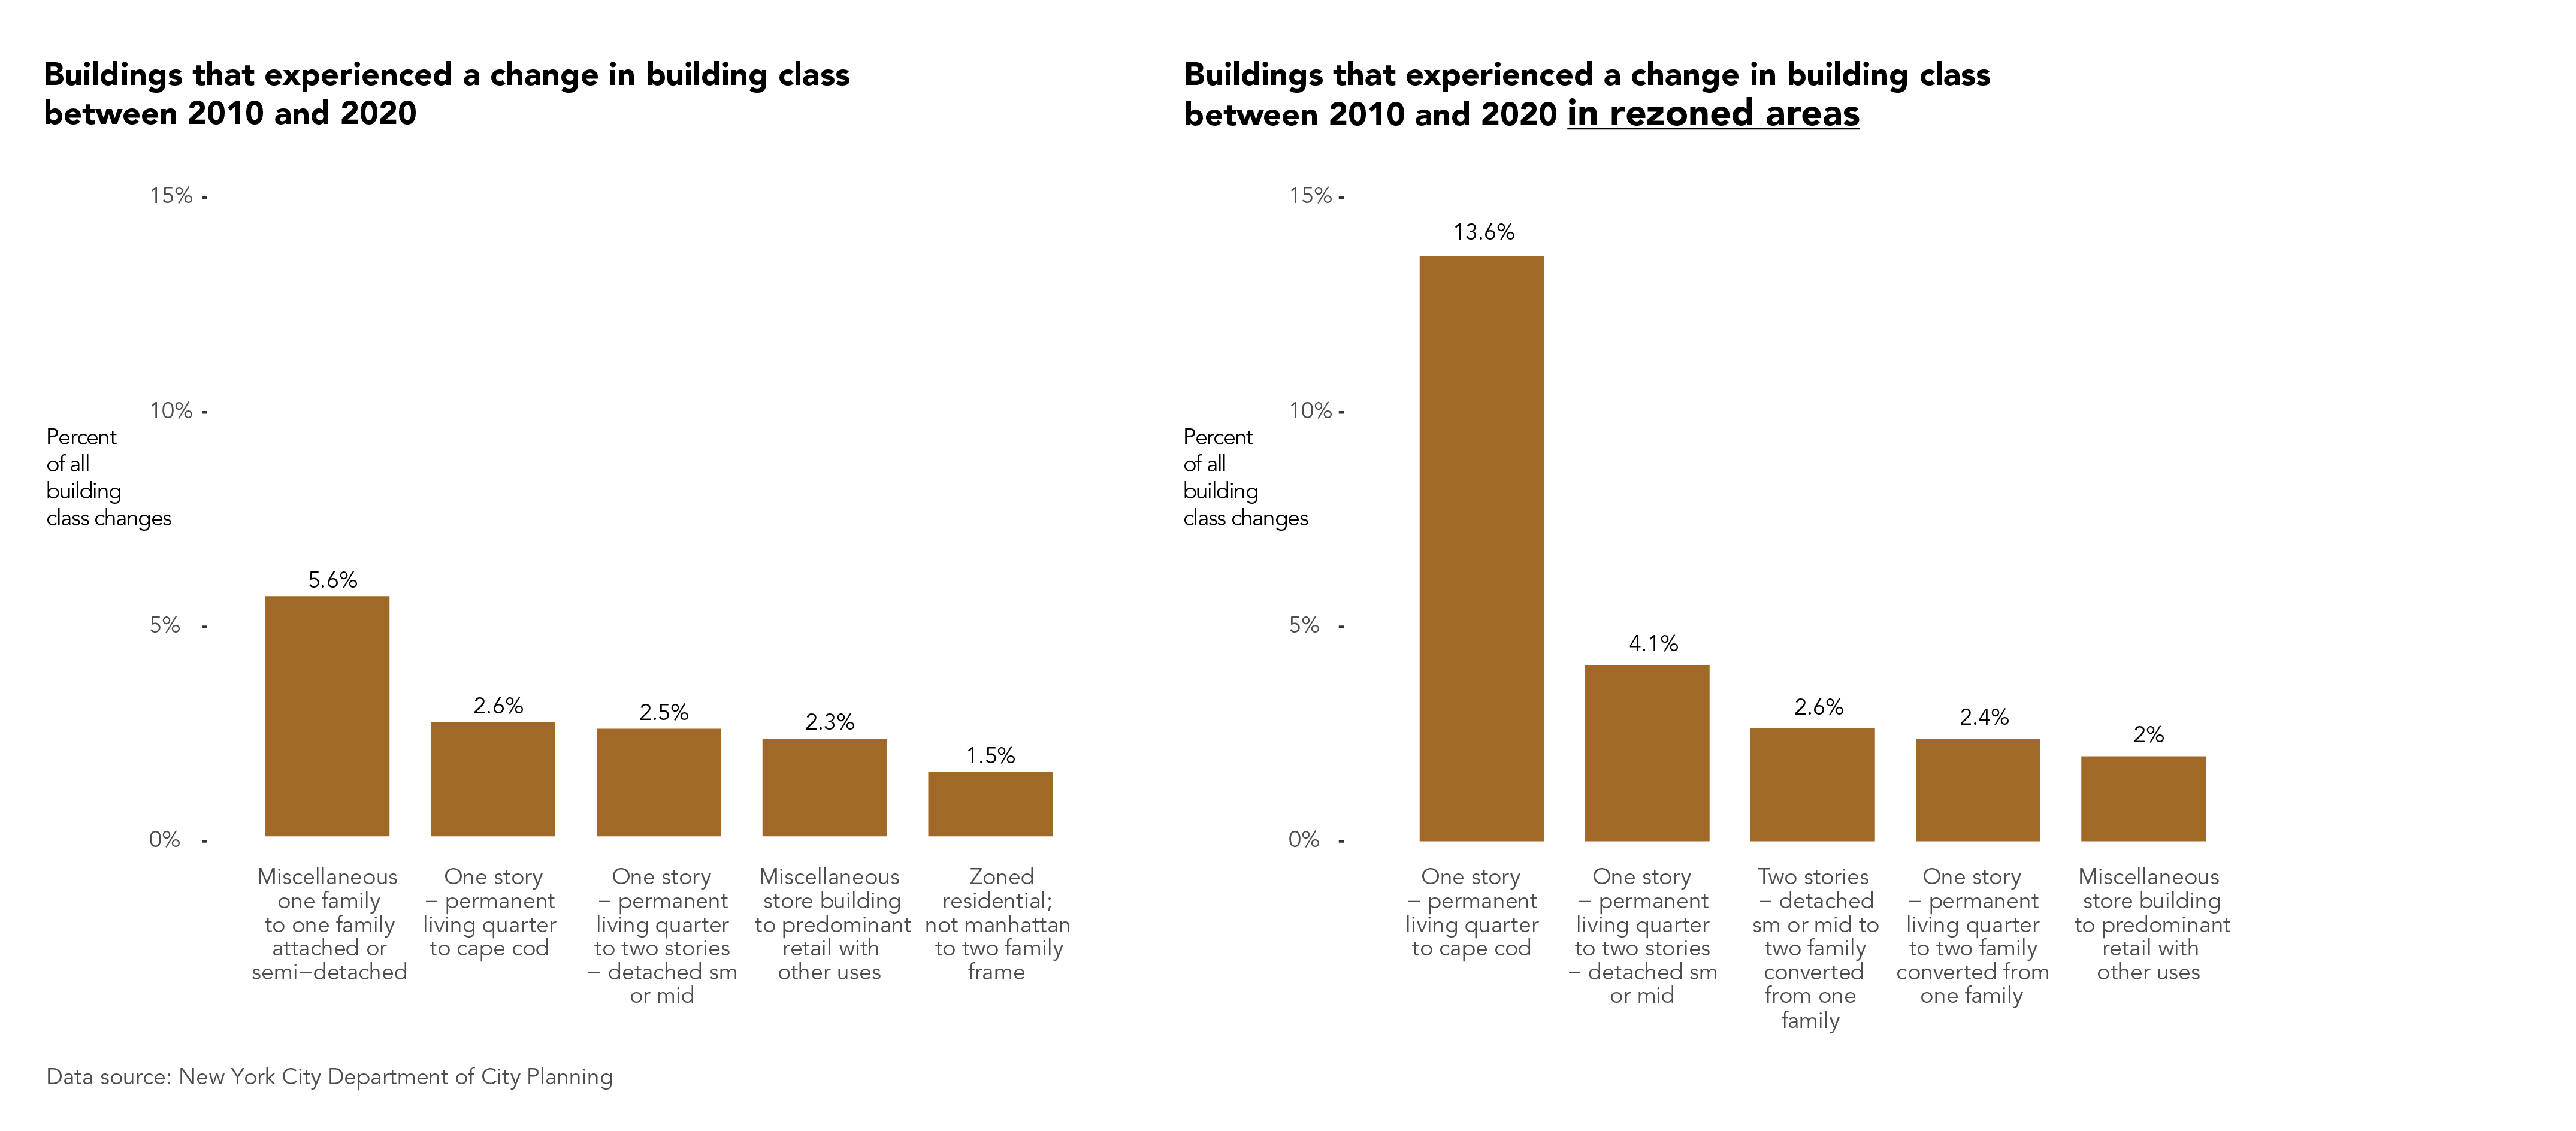
The differences in building class descriptions, illustrated in the figure above, indicate smaller, incremental changes in the built environment, even in rezoned areas. The highest percentages of building class description differences — out of all building class description differences citywide and in rezoned areas — involve changes from one-family to two-family houses. In rezoned areas, the highest percentage of differences is from “one story” to “cape cod.” Cape cod buildings are detached houses with steep roofs and around 90% of them exist in Queens. This finding perhaps illustrates the significant effect of the rezonings that occurred in Queens between 2010 and 2020.
The figure comparing changes in building class descriptions offers a different narrative. It suggests that residential density is fluctuating, but not substantively changing. At the same time, the technical language of building class descriptions obscures any understanding of broader trends. The difference between “two stories — detached” and a “two family converted from one family” has little meaning to a non-expert. Additionally, the level of detail generates small buckets of information; most combinations of building class changes were less than 1% of all changes.
To examine broader trends, I turned to land use categories. Land use categories are aggregated versions of building class descriptions. With land use categories, a clearer pattern appears. As one might expect, a high percentage of buildings overall and in rezoned areas convert vacant land to residential housing (9.7% overall and 9.2% in rezoned areas). These conversions aren’t conversions to tall skyscrapers, but rather to one- and two-family buildings. There are also more mixed-use buildings in 2020 compared to 2010. This finding is true citywide and in rezoned areas.
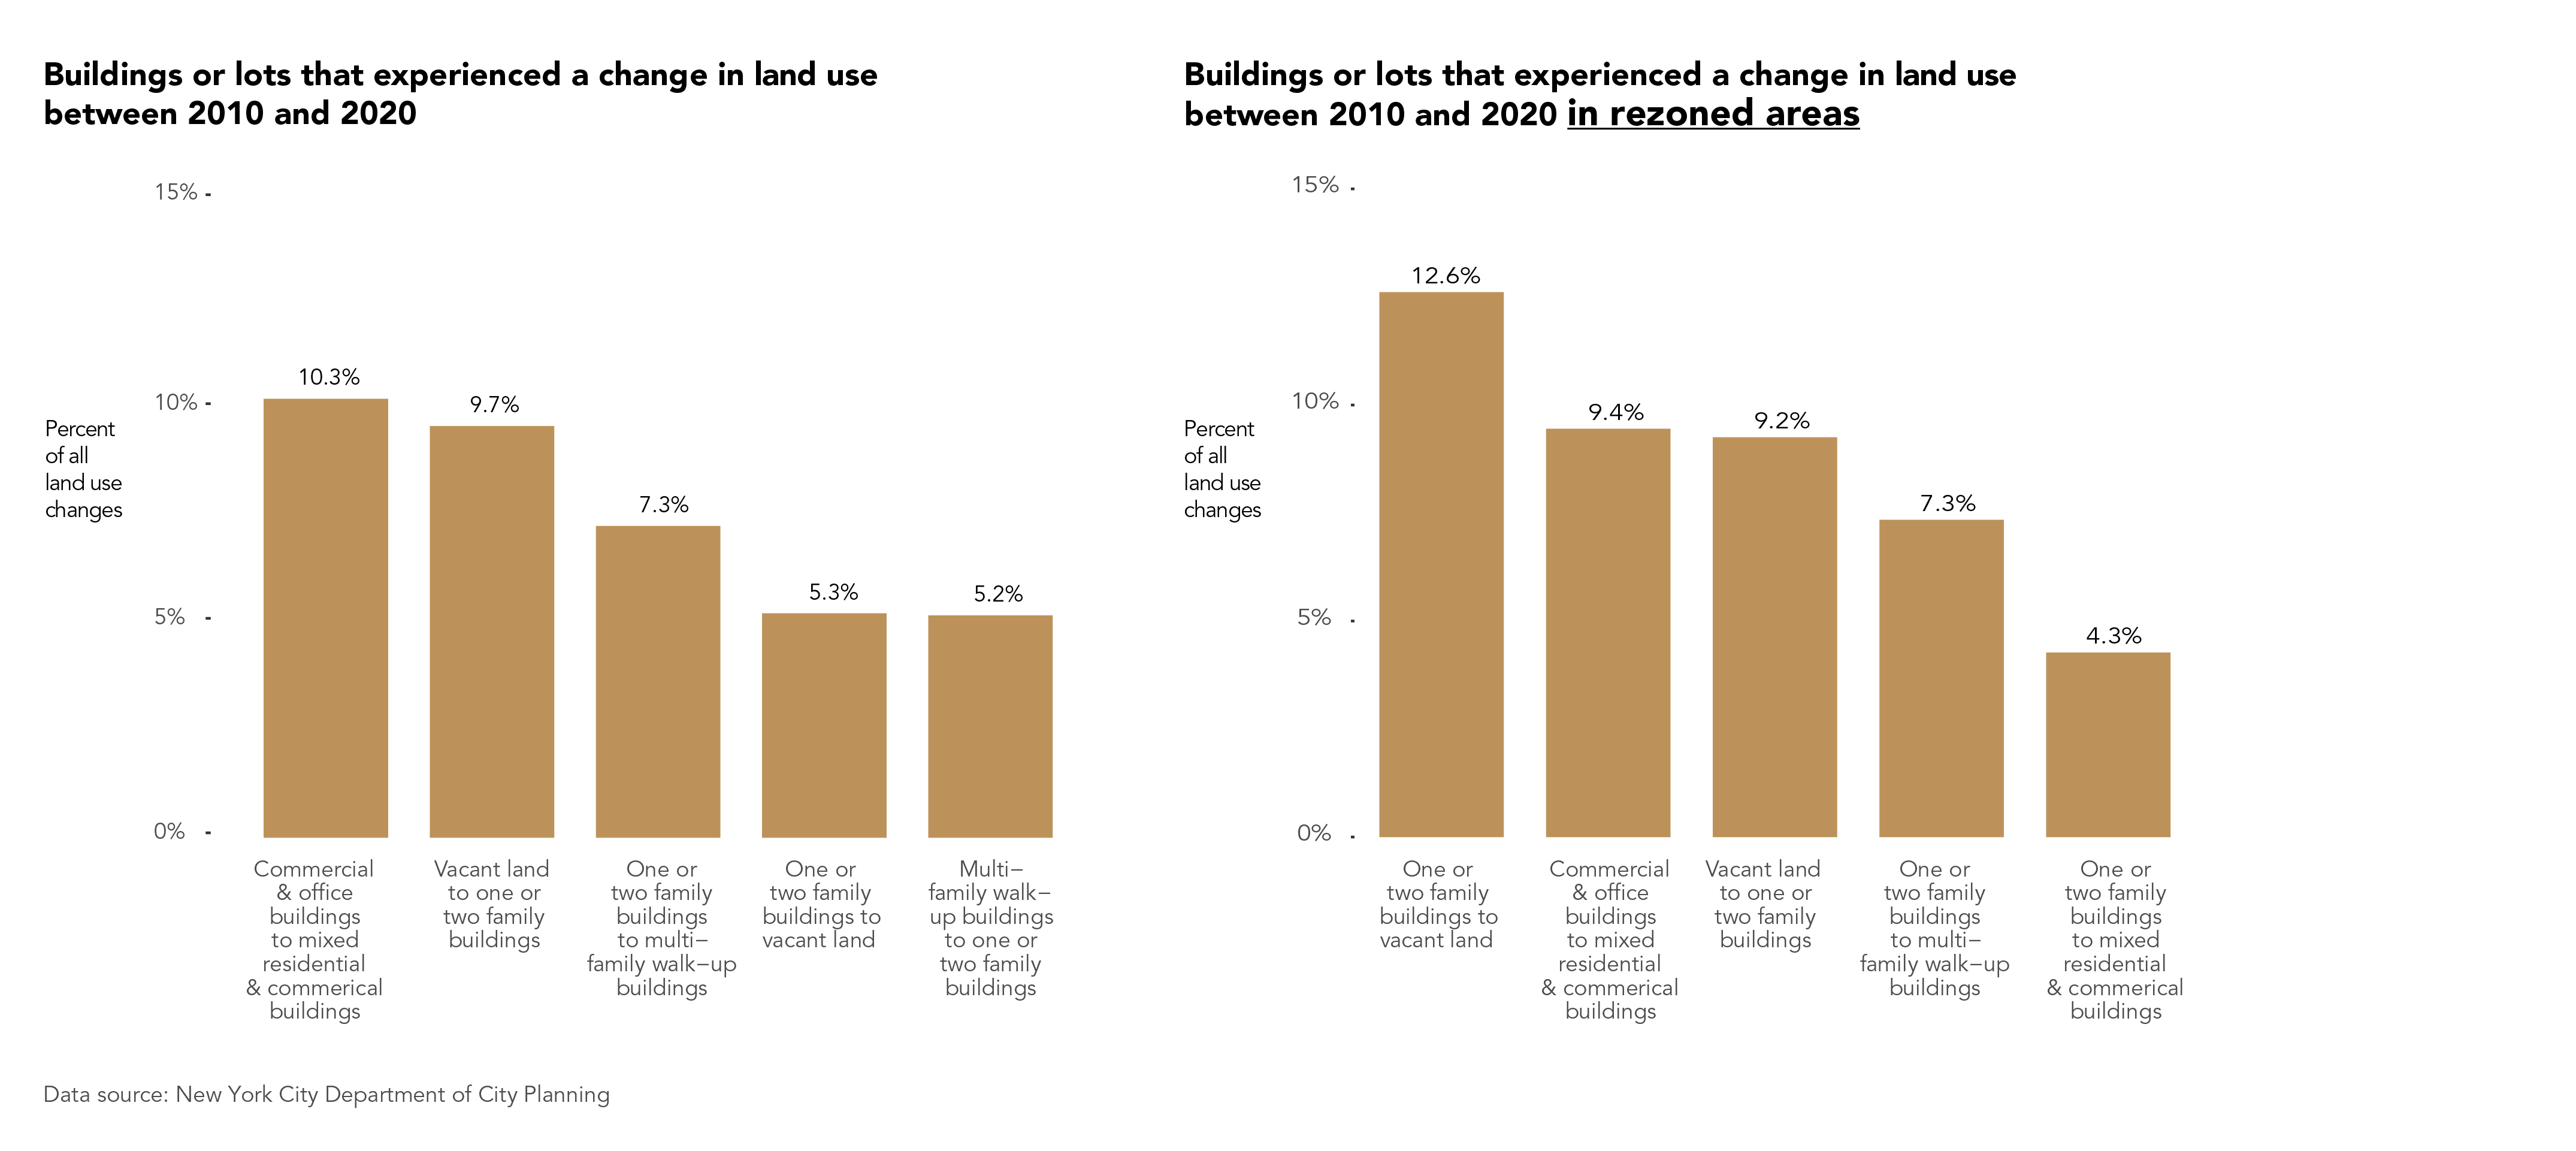
Overall, the highest percentage of land use changes are conversions from commercial and office space uses to mixed-use involving residential and commercial uses (10.3%). The pattern of land use changes does not look drastically different for rezoned areas compared to all areas citywide. The change from residential housing to vacant land, which is the highest percentage in rezoned areas and the fourth highest citywide, does stand out. After looking at a random sample of properties on Google Maps, I determined that many of these properties are likely under construction for new development. But this suggests that the dominant housing strategy is one of new development: one or two family buildings are knocked down and replaced rather than renovated.
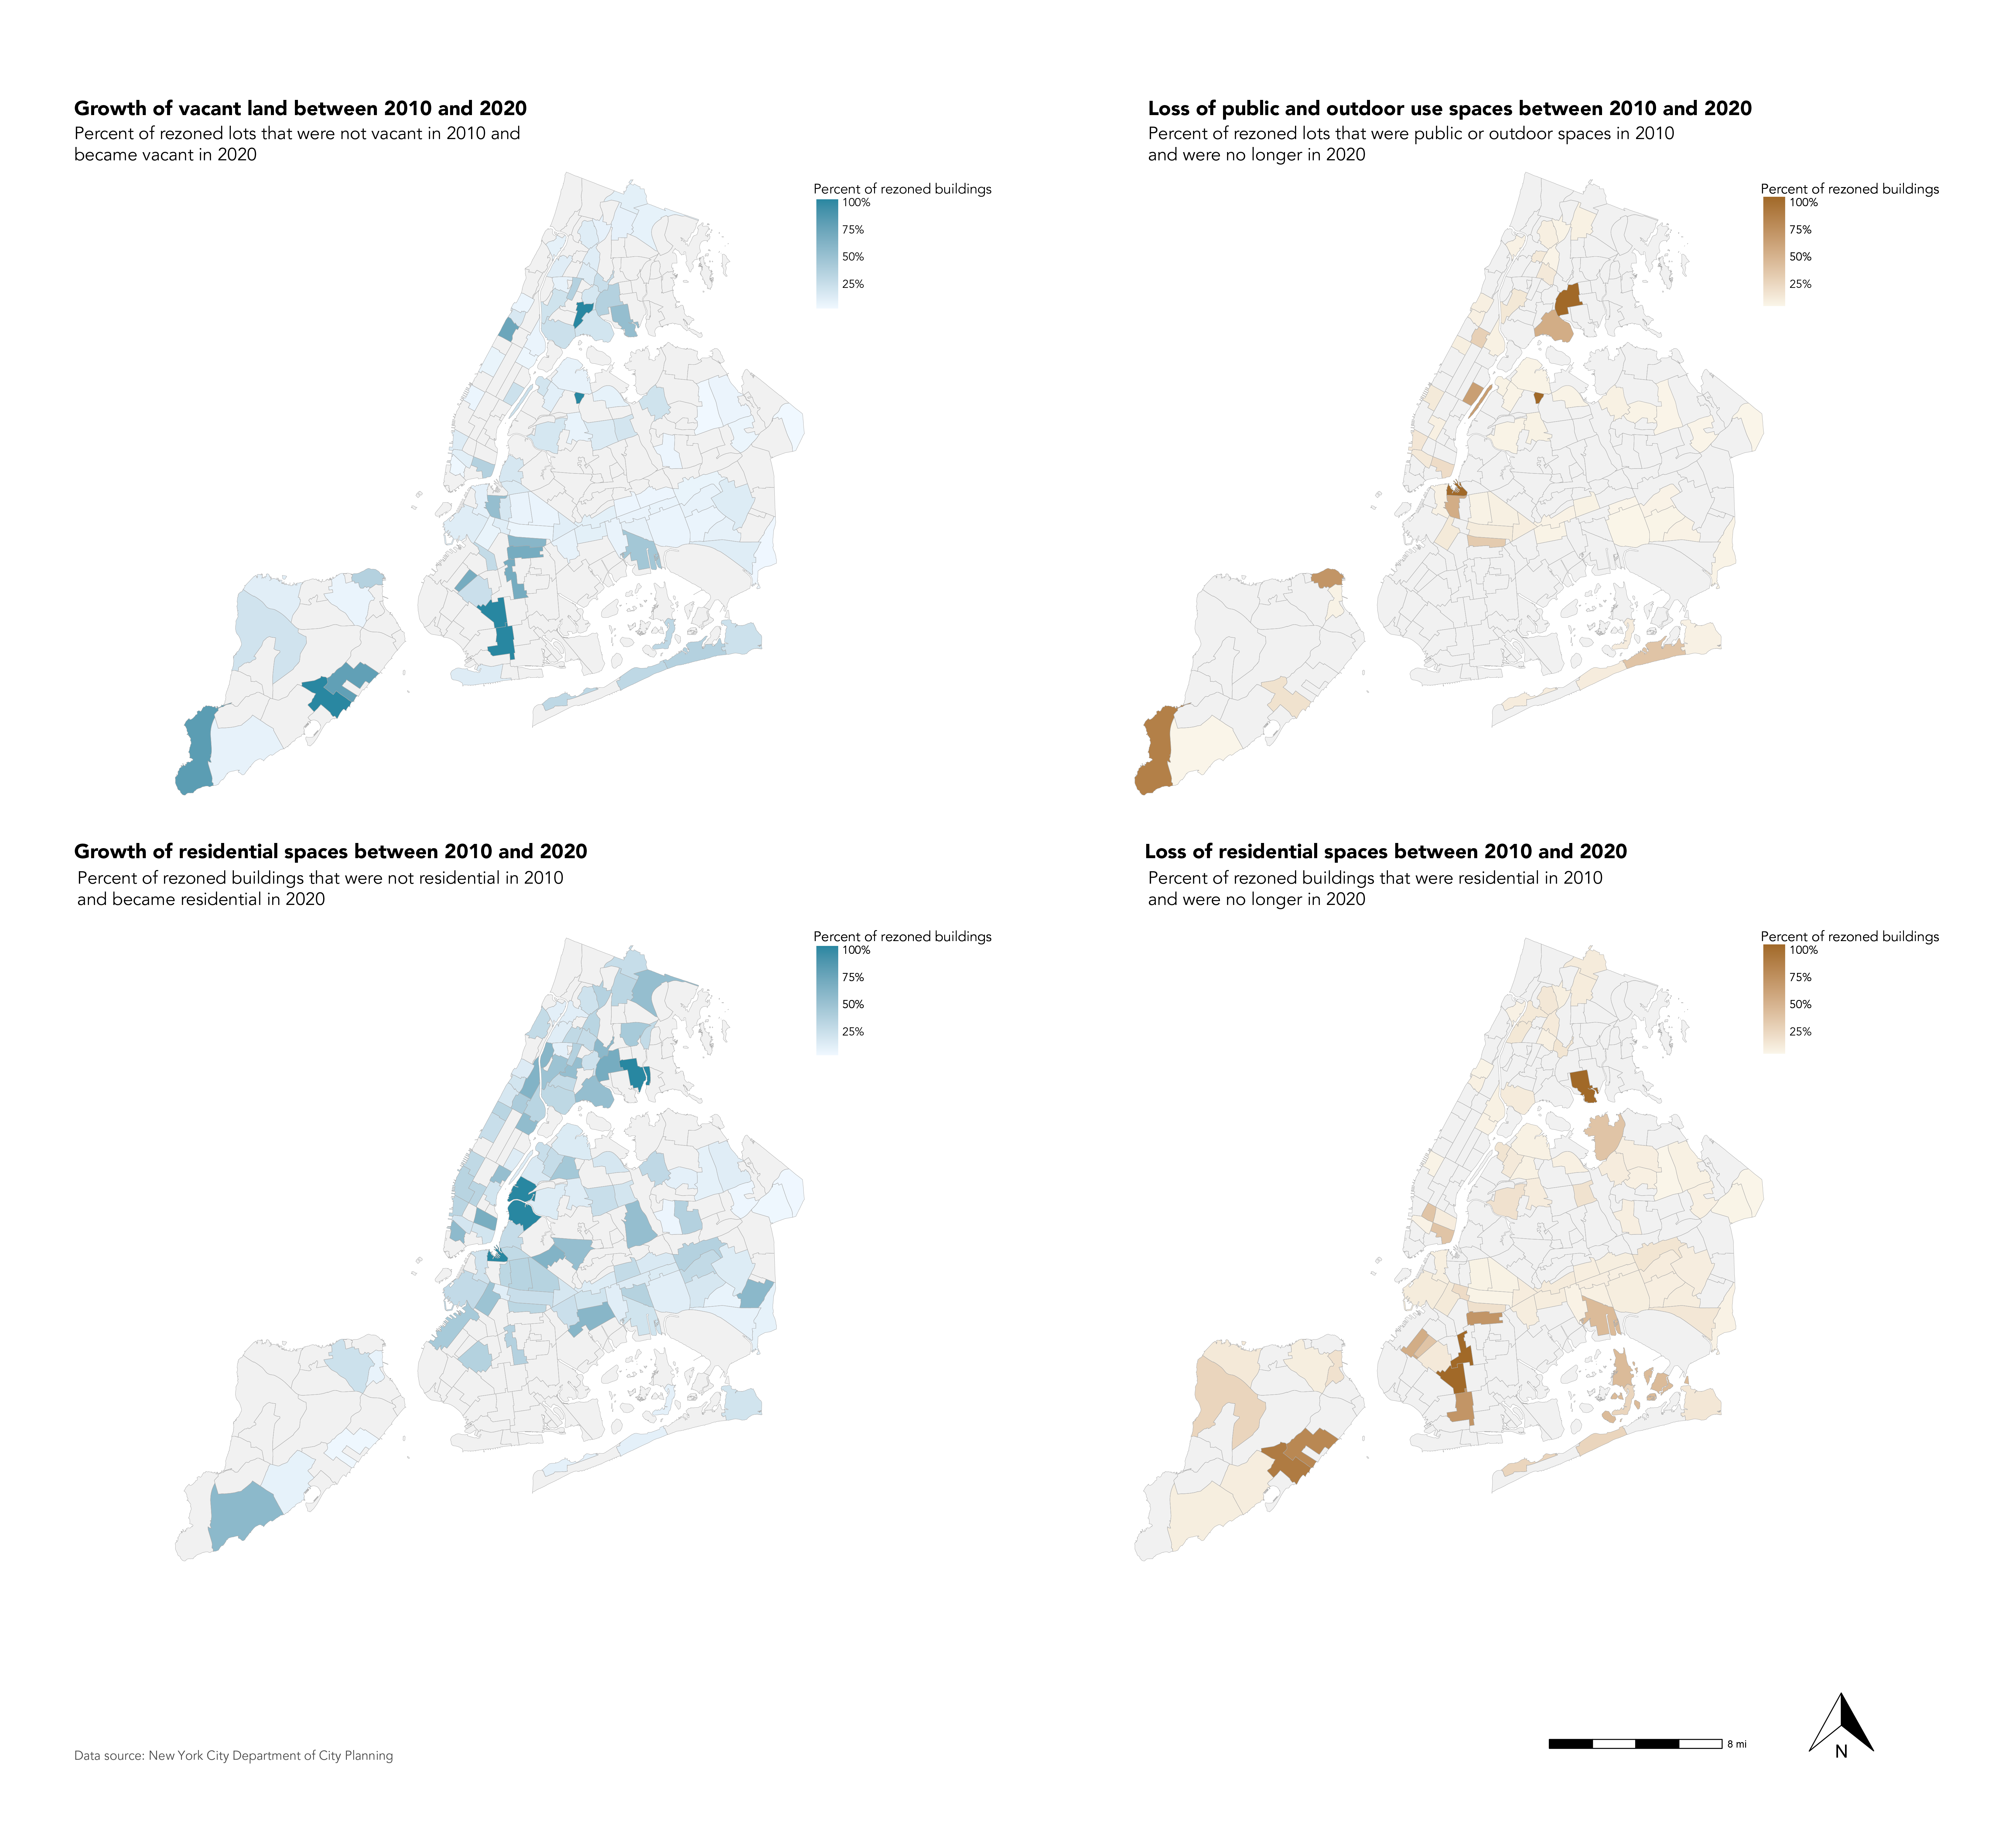
Based on land use changes between 2010 and 2020, I identified 4 outcomes to explore in greater detail in rezoned areas at the neighborhood level:
- Growth
- vacant land
- residential land
- Declines
- public and outdoor space
- residential land
The maps above reveal broad spatial trends related to land use changes in NYC. In neighborhoods in the southern parts of Brooklyn and the Bronx, for example, there have been significant increases in vacant land. Given that many vacant lots are likely in transition, this indicates where new development is taking place. The vacant land is probably temporary. In neighborhoods in south Brooklyn, the area of rezonings is much smaller, so the maps may also overinflate the importance of vacant land growth in those areas (since the maps use percentages).
The South Bronx, East Harlem, and Williamsburg are also areas that have experienced declines in public and outdoor space. These are also areas that have gained a higher percentage of housing, which illustrates one of the difficult tradeoffs in housing development: building new housing or providing public and outdoor space. In general, the gains and losses in residential housing in rezoned areas seem mixed across neighborhoods.
Conclusion
I’ve narrowly reviewed the changes that occurred in housing and land use citywide and in rezoned areas between 2010 and 2020. The findings do provoke questions for further study:
- Why do differences in building class descriptions reveal mostly small and largely insignificant residential changes (e.g. 1-family converted to a 2-family home)?
- What is the motivation for building class differences that do not increase density?
- What is the relationship between rezonings and vacant land?
- Why have some neighborhoods experienced declines in public and outdoor space? Given that such combinations of land use changes are more infrequent and did not feature in any of the land use graphs, perhaps these changes are unconnected to the rezonings, or they might have occurred in the context of a specific project. It would be useful to determine when such outcomes occur and why.
References
Angotti, T., & Morse, S. (2017). Zoned out!: Race, Displacement, and City Planning in New York City.Urban Research (UR).
Armstrong, A., Been, V., Madar, J., & McDonnell, S. (2010). How have recent rezonings affected the city’s ability to grow. The Furman Center for Real Estate and Urban Policy.
CityLand. (2007). Jamaica rezoning approved with modifications. Center for New York City Law.https://www.citylandnyc.org/jamaica-rezoning-approved-with-modifications/.
Gates, M. (2020). Five New York City Neighborhoods to Upzone for Affordable Housing. Regional Plan Association. https://rpa.org/latest/lab/rezoning-soho-next-five-neighborhoods.
Goldberg, L. L. M. (2015). Game of Zones: Neighborhood Rezonings and Uneven Urban Growth in Bloomberg’s New York City (Unpublished doctoral dissertation). Massachusetts Institute of Technology.
Kully, S. A. (2020, Sept). As NYC Neighborhoods Push Back against Rezonings, de Blasio’s Signature Housing Policy is Threatened. City Limits. https://citylimits.org/2020/09/10/six-down-one-to-go-where-de-blasios-rezonings-stand/.
New York City Planning. (n.d.-a). Bytes of the big apple™. Retrieved 2022-11-23, from https://www.nyc.gov/site/planning/data-maps/open-data.page.
New York City Planning. (n.d.-b). How zoning gets amended. https://www.nyc.gov/site/planning/zoning/about-how-zoning-gets-amended.page.
New York City Planning. (n.d.-c). NYC Gis Zoning Features. https://www.nyc.gov/site/planning/data-maps/open-data/dwn-gis-zoning.page.
New York City Planning. (n.d.-d). Special purpose districts: Citywide. https://www.nyc.gov/site/planning/zoning/districts-tools/special-purpose-districts-citywide.page.
New York City Planning. (n.d.-e). What is zoning? https://www.nyc.gov/site/planning/zoning/about-zoning.page.
Rafter, D. (2013). Ozone park rezoning plan moving forward. Queens Chronicle. https://www.qchron.com/editions/south/ozone-park-rezoning-plan-moving-forward/articleed6e6730-2cd4-59dc-816e-6d31c09de586.html.
Spivack, C. (2020, Mar). As NYC Neighborhoods Push Back against Rezonings, de blasio’s Signature Housing Policy is Threatened. Curbed NY. https://ny.curbed.com/2020/2/6/21123983/nyc-affordable-housing-rezoning-bill-de-blasio.
ULURP Explained. (n.d.). City Limits. https://citylimits.org/zonein/ulurp-explained/.
Walters, C. (2021). Not all housing units are created equal. The Association for Neighborhood & Housing Development. https://anhd.org/report/not-all-housing-units-are-created-equal.
Williams, K. (2018, Mar). Breaking down the city’s rezoning process. The New York Times. https://www.nytimes.com/2018/03/15/nyregion/breaking-down-the-citys-rezoning-process.html.